





Business Usage Data
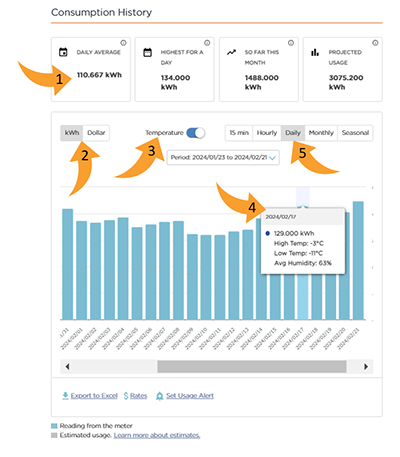
Five new Consumption History features to explore:
- The boxes above the graph provide key insights about your energy usage, including Highest for a Day and Load Factor %. Learn more about Load Factor.
- You can choose to view your power in kilowatts (kW)or kilovolt ampere (kVA) (if applicable).
- The temperature overlay toggle allows you to see how weather trends impacted your energy use.
- When you click on a bar in the graph, additional information about that time period will pop up, including high and low temperature and humidity./li>
- Instead of simply seeing monthly and seasonal usage, you can now view your daily, hourly and 15-minute energy use displayed.